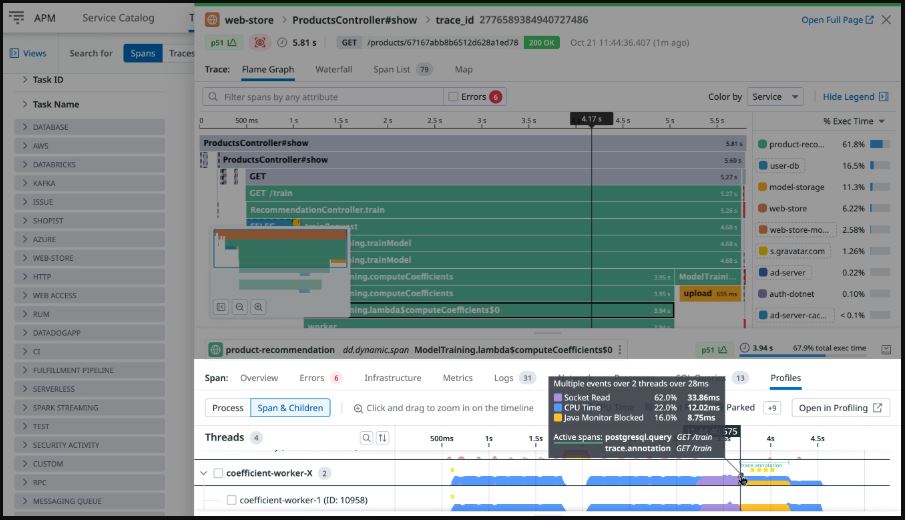
screenshot taken from: https://docs.datadoghq.com/profiler/
When
Thursday, 29th January 2026, 6:00pm to 9:00pm
Where
Spiced Academy, Ritterstrasse 12, Berlin, Germany
Hosting Organization
Datadog User Group Berlin
Participation Fee
Free Entrance
Agenda
Host Intro, Talk 1, Talk 2, Talk 3, Food & Socializing
Topics Covered
Sponsors Spiced Academy & Rackspace Technology, Code of Conduct and Housekeeping (Host Intro), End-to-End Observability for Event-Driven Architectures (Talk 1), How Zendesk Optimized Datadog at Scale for Cost Efficient Observability (Talk 2), Continuous Profiling in Practice with Datadog (Talk 3)
I’ve learned something today
- In software engineering, essential complexity is the inherent difficulty of the business domain itself, arising from real business rules, constraints, and interactions that the system must correctly represent. Accidental complexity is the additional difficulty created by implementation choices, tooling, or design decisions, and it adds cognitive and operational burden without being required by the problem.
- In distributed systems, failures are often masked by retries, fallbacks, and partial degradation, so raw error counts can stay low even while the system is unhealthy. A declining success count cuts through that noise by directly reflecting user-visible outcomes, making it one of the earliest and most reliable signals that something is going wrong.
- In observability, cost control works best when trace volume, log ingestion, and log indexing are treated as independent levers, each optimized differently based on the value it provides. For example, keeping only high-signal root spans can reduce tracing costs, while excluding low-value logs at ingestion and tightly controlling what gets indexed can dramatically cut spend without harming debuggability.
- Continuous profiling differs from metrics, logs, and traces by revealing what the code is actually doing on the CPU and in memory, not just how the system appears to behave. If the first three pillars of observability provide a bird’s eye view of system health and request flow, the fourth pillar continuous profiling zooms in to show exactly which lines of code are responsible for cost, latency, and contention.
- For anyone interested in a strong real world FinOps case study, the article “How we used Datadog to save $17.5 million annually”, published in The Monitor, Datadog’s engineering blog, is highly recommended.
It shows how combining cost visibility, continuous profiling, and network insights turns performance optimization into measurable and repeatable financial impact. - Event-driven architectures are about system design, where services communicate by publishing and reacting to events without knowing who consumes them. Event-based compute is about execution model, where compute is created only when an event occurs and processes one event at a time, shaping how code is written, initialized, and scaled.
- Reaching the Spiced Academy venue was hazardous due to icy pavements, a problem currently affecting much of Berlin:

picture taken at venue
Published:
Modified: